

Introduction
"Debugging is like being the detective in a crime movie where you are also the murderer." - Filipe Fortes
During Software development, we always face bugs that need to fix. Most of the time the error log helps us identify the bug. But when the errors are logical it's of little use.
We need to check the code step by step and figure out what's going wrong.
The Problem
For most PHP developers, this is how to code debugging works.
- Code is not working as expected
- Put
var_dump()&echo()statement - Run the code check the printed value in the browser
- Remove old
var_dump()&echo()statement & add new - Re-run the code
- Pray to God, you will figure out the issue this time.
- And the cycle continues.
The solution to it is simple to invest a few hours and learn how debugging tools like Xdebug works & how to configure it in the IDE.
The Solution
Out of all the other programming language's I have worked in Like Node JS, Python, I Setting up a debugger is relatively difficult when it comes to PHP. Even popular development environments like XMPP, WMPP, Laragon don't come with Xdebug preinstalled.
In this article, I will give step by step guide on how to set up a debugger and how to use it while debugging code.
TL;DR
Irrespective of OS & development environment, the steps remain the same.
- Download Xdebug extension from the website.
- Copy it into the extensions folder
- Update
php.inifile to enable the extension - Update a few settings in IDE.
- You are good to go.
Here I am using
- Windows 10
- Laragon (I highly recommend using it)
- PHPstrom
Step 1: Determine which Xdebug file to download
- Create
index.php - Copy below code snippet.
<?php
 phpinfo();
- Open it in the browser.
- Copy all the content.
- Visit https://xdebug.org/wizard
- Paste the copied content
- Click on
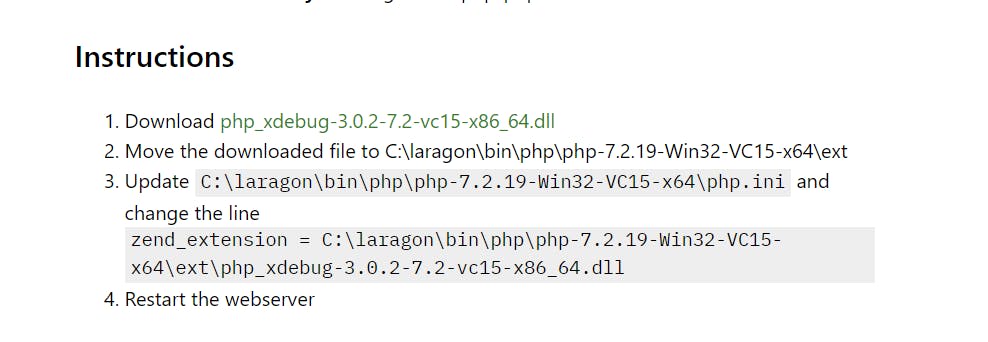
Analyse my phpinfo() output - On the next page instructions will be shown to install Xdebug
For me, the output of the step was like below
Step 2. Enable the extension
- Follow the instructions provided in step 1
- Add below configuration in
php.ini& restart the webserver.
[XDebug]
xdebug.profiler_enable = 1
xdebug.mode=debug
xdebug.profiler_output_dir = "C:\laragon\www\xdebug"
- Make sure
xdebug.profiler_output_diris a valid directory. - On successful activation, Xdebug will appear in phpinfo file like below

Step 3. Configure PHPStrom IDE
We can say PhpStorm is a perfect PHP IDE when it comes to development in PHP, It has lots of options when it comes to debugging a PHP application which is covered here .
Here I will cover how to debug a web application a simple web application.
- Open setting ctrl+alt+s or File + Settings
- Navigate to Language & Frameworks -> PHP -> Debug
- Under Pre-configuration click on validate debugger configuration.
- Incase there is any error in configuration it will be highlighted along with steps to fix it.
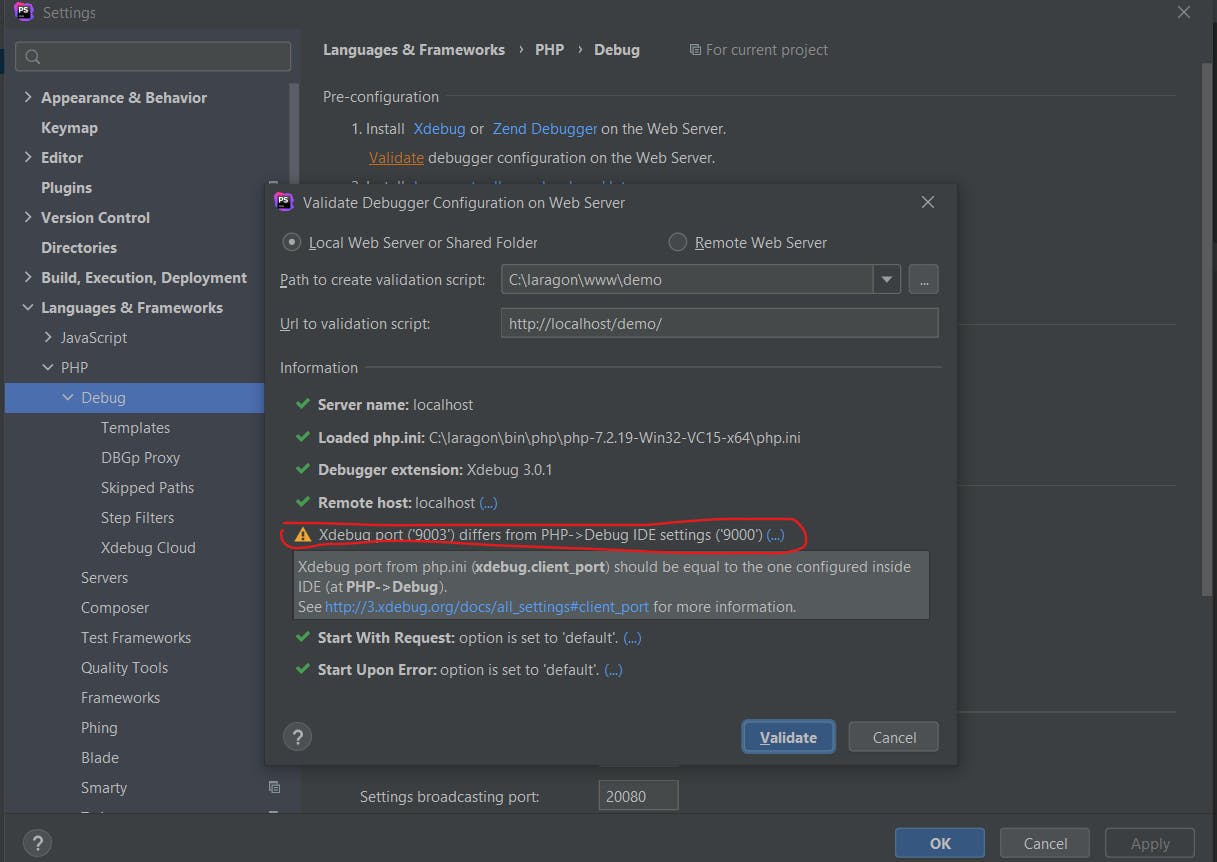
- Follow the instructions to fix the issue and again validate the configuration.
- Install browser toolbar
- Enable Listening for PHP debug connection.
Demo
Hope this guide was helpful to you.
Happy debugging.